
Estimates of station usage

Annual estimates of the number of entries/exits and interchanges at each station in Great Britain. These estimates are based primarily on ticket sales and are produced by Steer on behalf of ORR. Please note that we have incorporated our Regional rail usage statistics into this publication.
For details on how these statistics are compiled, please see our Estimates of station usage quality and methodology report. We have also produced a list of frequently asked questions. For any information on revisions, please see our Revisions log.
Data and reports that include previous statistical releases on Estimates of station usage can be found on the National Archives.
Our statistical practice is regulated by the Office for Statistics Regulation (OSR).
If you have any questions or feedback on these statistics, please contact rail.stats@orr.gov.uk
The origin destination matrix (ODM) that underpins our Estimates of station usage data is now freely available on the Rail Data Marketplace.
We produce a number of animated charts and infographics:
Latest statistical release
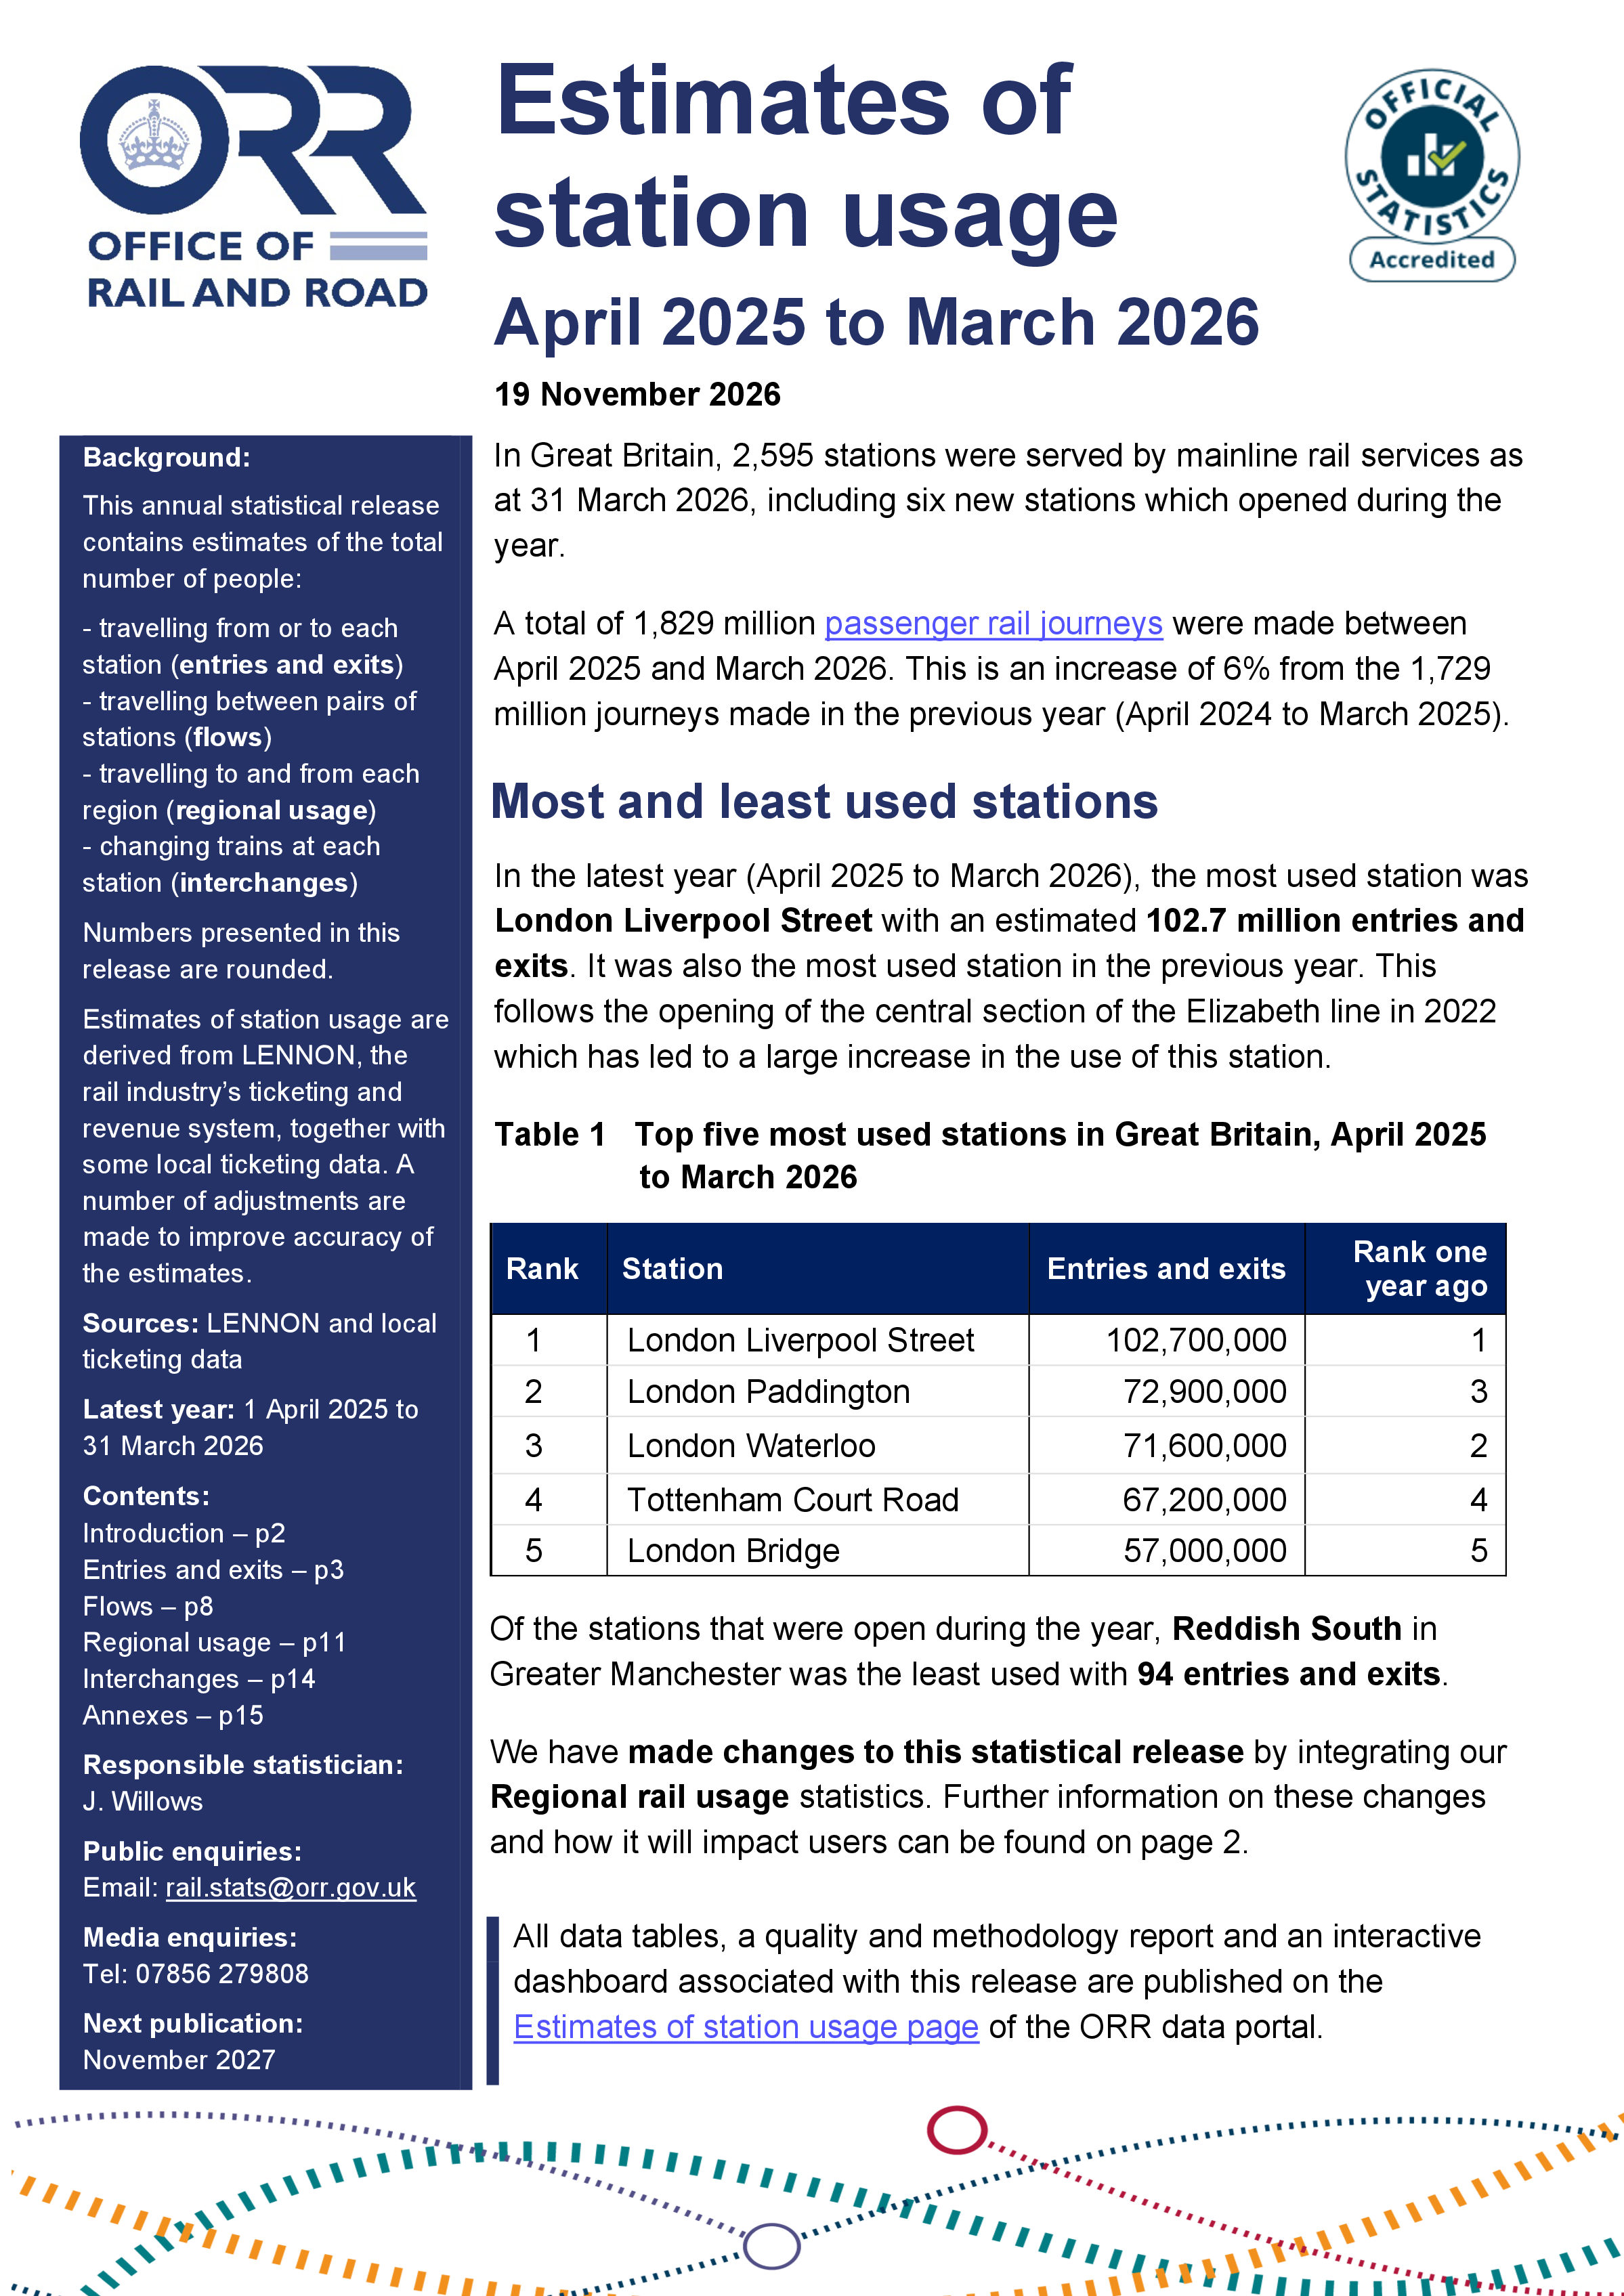
Estimates of station usage, April 2025 to March 2026
Date published: 19 Nov 2026
Date next published: TBC
Key results
- In the latest year (April 2025 to March 2026), the most used station was London Liverpool Street with an estimated 102.7 million entries and exits.
- Reddish South in Greater Manchester was the least used with just 94 entries and exits.
- In the latest year, the busiest flow was between Tottenham Court Road and London Liverpool Street, with 8.2 million journeys.
Previous statistical releases
-
2024-25
-
2023-24
-
2022-23
-
2021-22
-
2020-21
Data tables
-
Annual
- Table 1410: Passenger entries and exits and interchanges by station
- Table 1415: Time series of passenger entries and exits and interchanges by station
- Table 1510: Regional passenger journeys between England, Scotland and Wales
- Table 1520: Regional passenger journeys between and within Regions
- Table 1595: Passenger journeys between local authorities (csv)
- Table 1410: Passenger entries and exits and interchanges by station (csv)