Rail environment
 Annual statistics covering electricity and diesel consumption of mainline passenger and freight operators in Great Britain, estimates of their associated CO2e emissions and other environmental measures for non-traction energy, water and waste.
For details on how these statistics are compiled, please see our Rail environment quality and methodology report and for information on any revisions, please see our Revisions log. We have also produced a Rail emissions data catalogue.
This release includes official statistics in development on non-traction energy consumption, water consumption and waste generation for passenger and freight operators. We have published a Rail environment statistics development plan, which sets out our ongoing work to develop these measures.
Rail emissions data were previously combined into the Rail infrastructure, assets and environmental release. From 1 April 2018, a separate statistical release has been published. It was previously named Rail emissions, but has been renamed to Rail environment as it includes additional environmental metrics.
Data and reports that include historic statistical releases on Rail infrastructure, assets & environmental can be found on the National Archives.
Our statistical practice is regulated by the Office for Statistics Regulation (OSR).
If you have any questions or feedback on these statistics, please contact rail.stats@orr.gov.uk
Latest statistical release
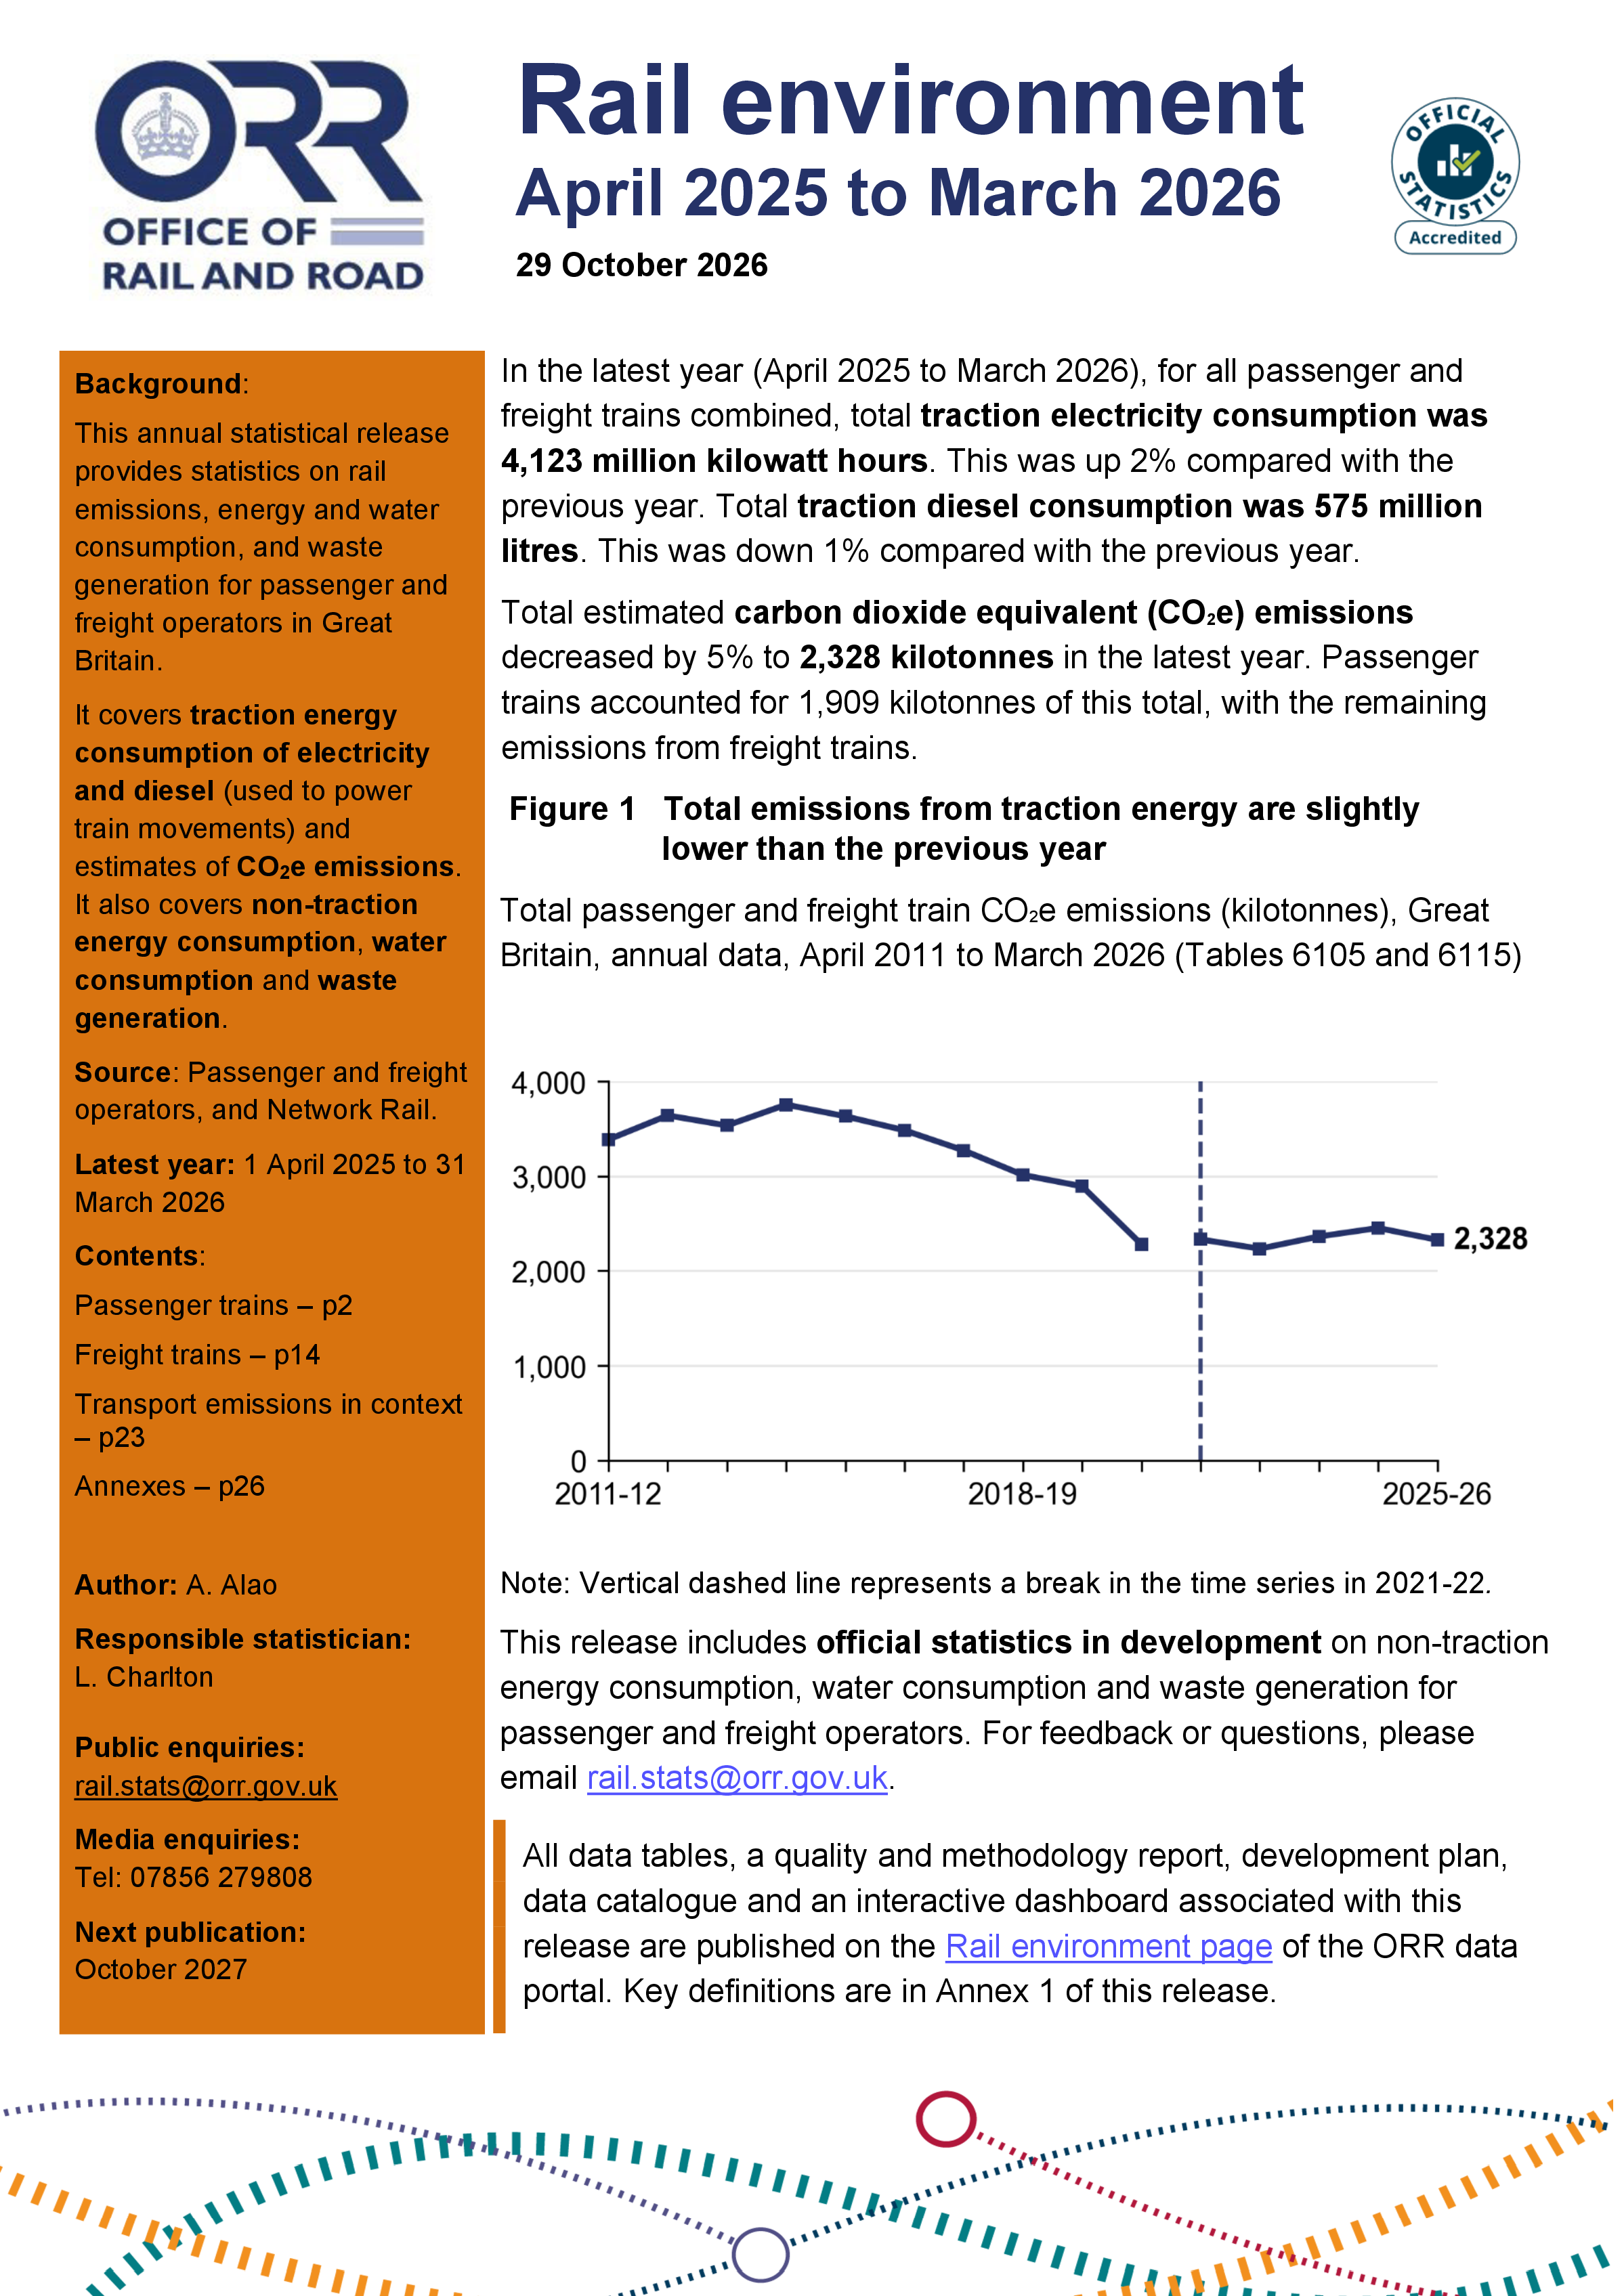
Rail environment, April 2025 to March 2026
Date published: 29 Oct 2026
Date next published: TBC
Key results
- In the latest year (April 2025 to March 2026), total traction electricity consumption increased by 2% and total traction diesel consumption decreased by 1% on the previous year. Total estimated carbon dioxide equivalent (CO2e) emissions decreased by 5% to 2,328 kilotonnes.
- Passenger train emissions per passenger kilometre were 28 grams of CO2e. This was down 9% on the previous year.
- Passenger train emissions from electricity consumption decreased by 13%, while emissions from diesel consumption increased by 1%.
- Freight train emissions per net tonne kilometre were 25 grams of CO2e. This was down 3% on the previous year.
Previous statistical releases
-
2024-25
-
2023-24
-
2022-23
-
2021-22
-
2020-21
-
2019-20
Data tables
-
Annual
- Table 6100 - Estimates of normalised passenger carbon dioxide equivalent (CO2e) emissions
- Table 6103 - Estimates of normalised passenger carbon dioxide equivalent (CO2e) emissions by operator
- Table 6105 - Estimates of passenger energy consumption and carbon dioxide equivalent (CO2e) emissions
- Table 6108 - Estimates of passenger energy consumption and carbon dioxide equivalent (CO2e) emissions by operator
- Table 6110 - Estimates of normalised freight carbon dioxide equivalent (CO2e) emissions
- Table 6113 - Estimates of normalised freight carbon dioxide equivalent (CO2e) emissions by operator
- Table 6115 - Estimates of freight energy consumption and carbon dioxide equivalent (CO2e) emissions
- Table 6118 - Estimates of freight energy consumption and carbon dioxide equivalent (CO2e) emissions by operator
- Table 6123 - Estimates of non-traction energy consumption by passenger operator
- Table 6133 - Estimates of non-traction energy consumption by freight operator
- Table 6143 - Water consumption by passenger operator
- Table 6153 - Water consumption by freight operator
- Table 6163 - Waste generation by passenger operator
- Table 6173 - Waste generation by freight operator