Passenger rail service complaints

Biannual statistics on the volume and cause of complaints made to train operating companies. This data forms part of ORR's core consumer data requirements from train operating companies; more information can be found at ORR core data.
Data is shown by financial year quarter: Q1 is April to June; Q2 is July to September; Q3 is October to December; and Q4 is January to March. From 1 April 2024, quarterly data will be published twice a year (January and June).
For details on how these statistics are compiled, please see our Passenger rail service complaints and delay compensation claims quality and methodology report and for information on any revisions, please see our Revisions log.
Data and reports that include previous statistical releases on Passenger rail service complaints can be found on the National Archives.
Our statistical practice is regulated by the Office for Statistics Regulation (OSR).
If you have any questions or feedback on these statistics, please contact rail.stats@orr.gov.uk
NOTE: The annual appeals closed by category and operator data tables (Table 4160 and Table 4163), due to be published on 25th June, have been delayed. This is due to a data quality issue we are working to resolve. The publication date will be updated in due course. Whilst this is investigated, we have removed the tables from this page.
Latest statistical release
Passenger rail service complaints, October 2025 to March 2026
Date published: 25 Jun 2026
Date next published: 14 Jan 2027
Key results
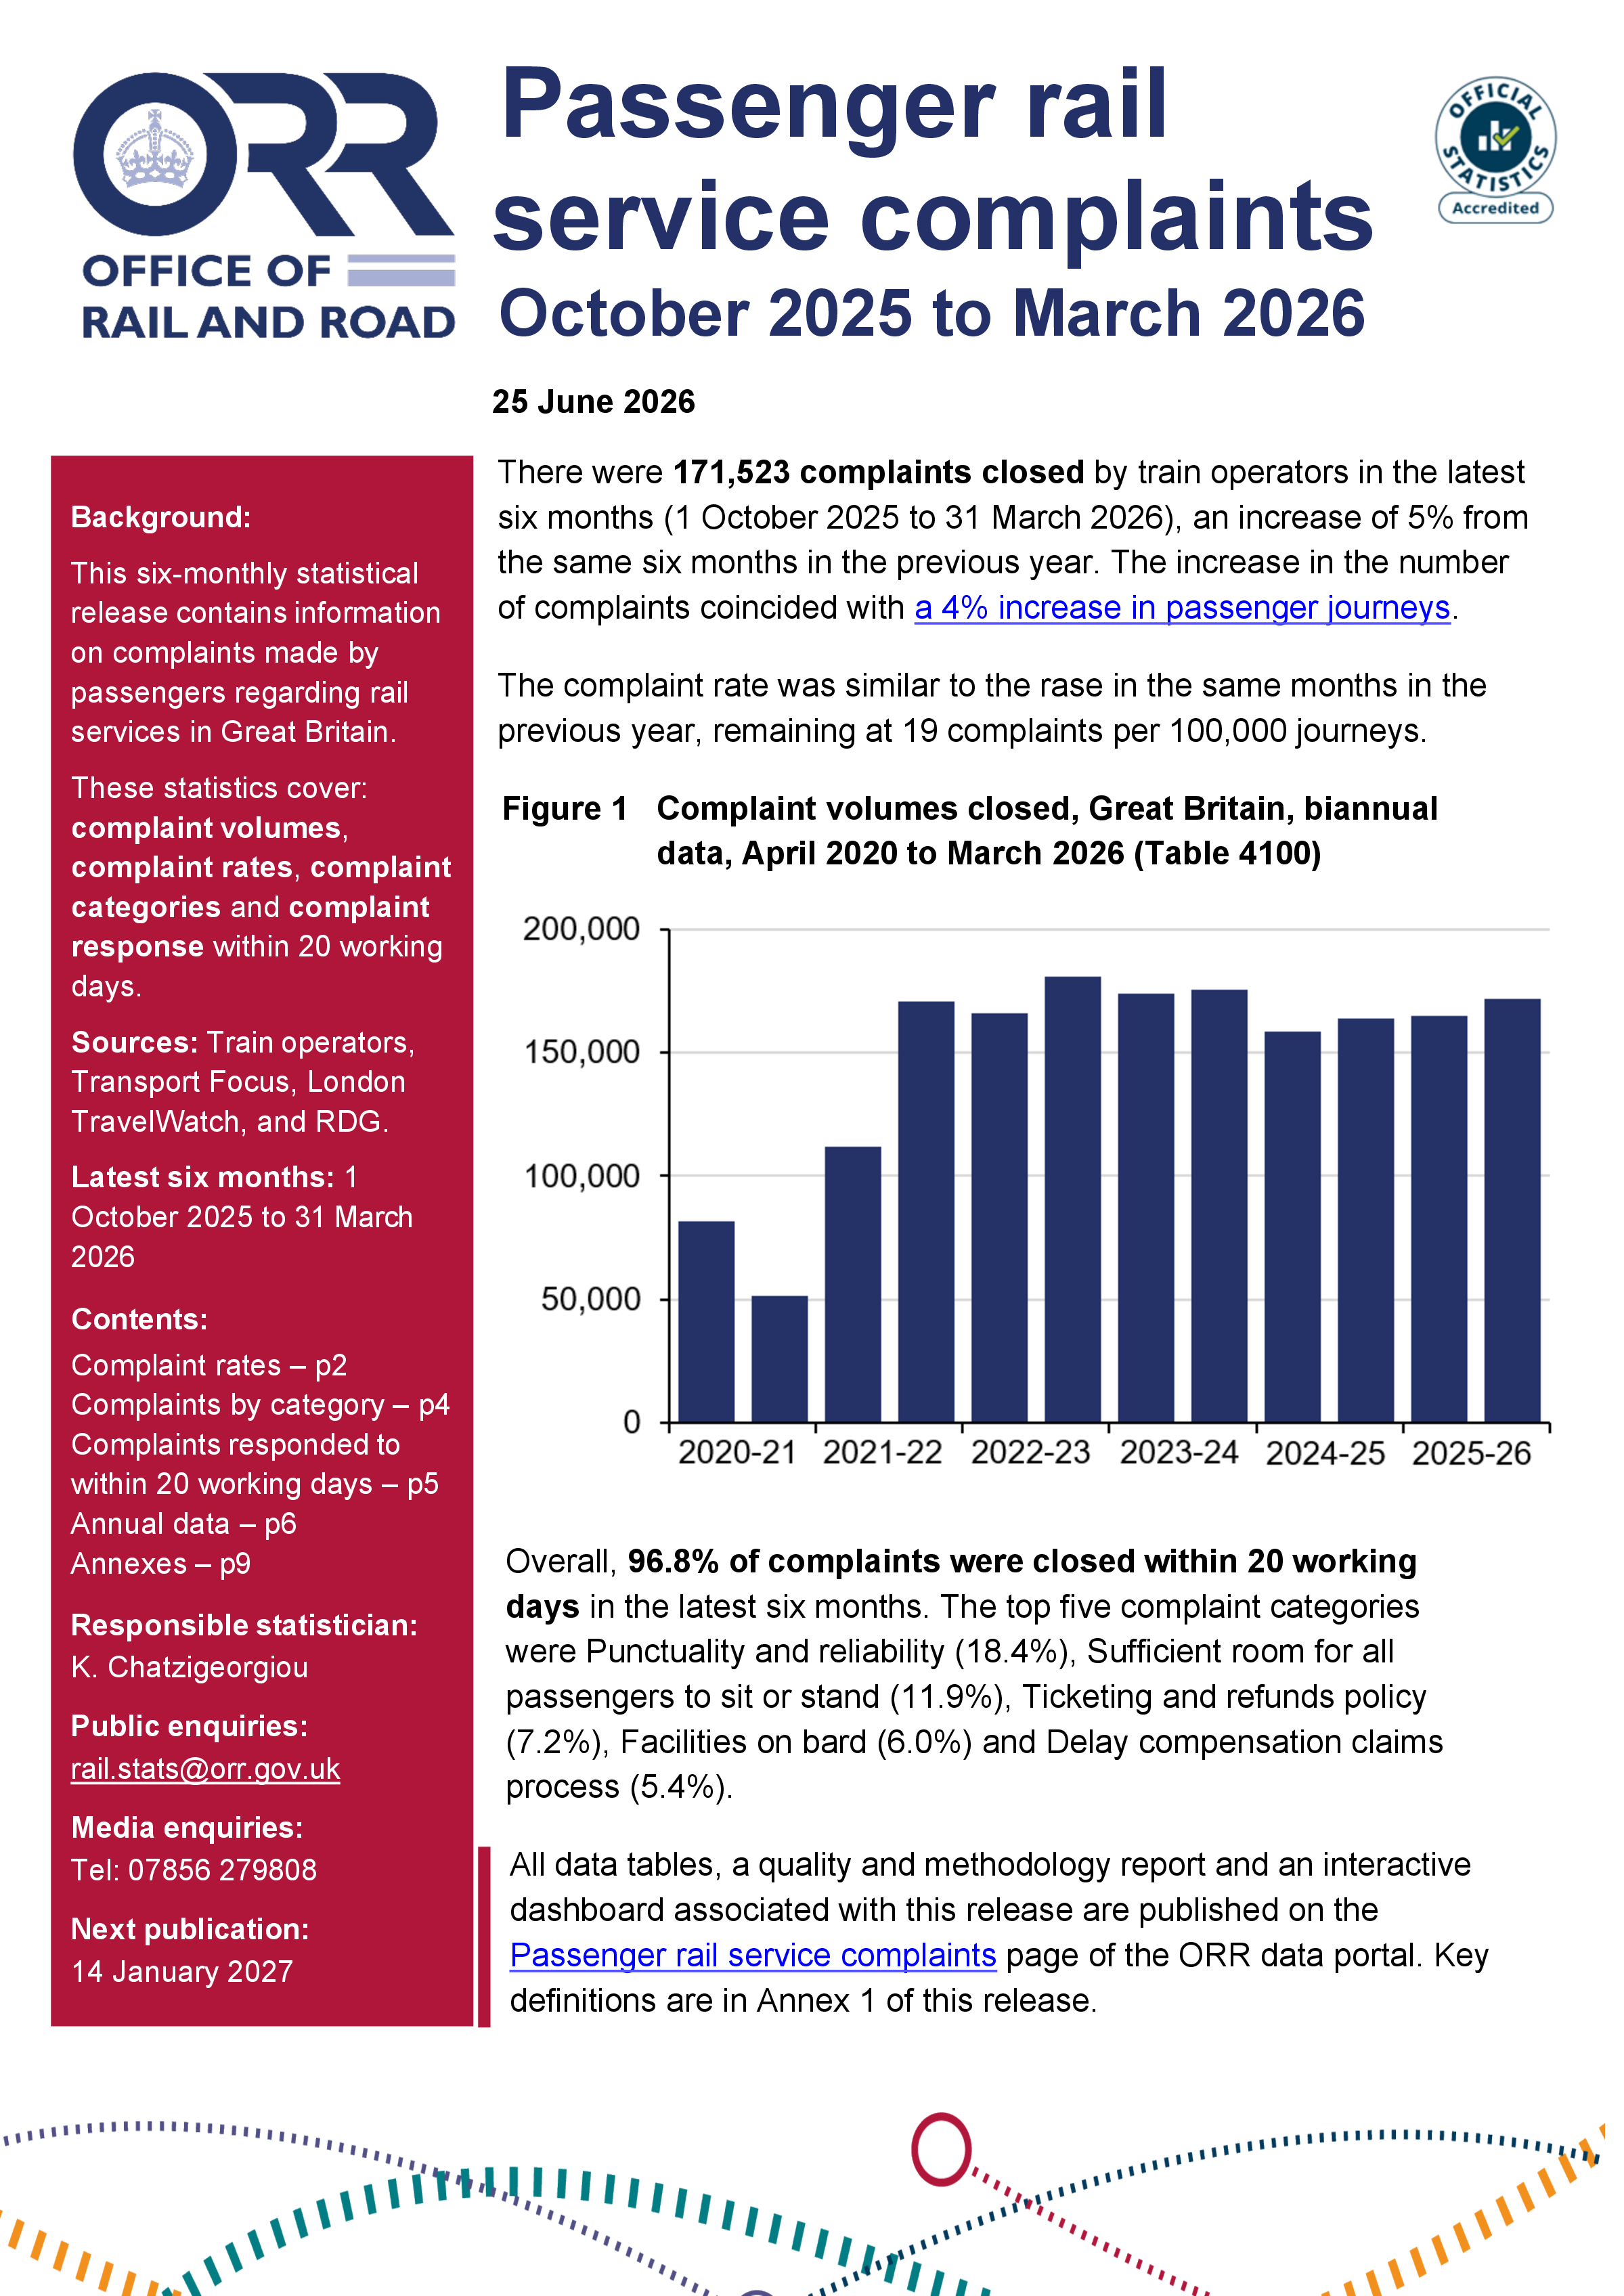
- There were 336,332 complaints closed by train operators in the latest year (1 April 2025 to 31 March 2026), an increase of 4% from the previous year, which is a rate of 18.4 complaints per 100,000 journeys. There were 171,523 complaints closed by train operators in the latest six months (1 October 2025 to 31 March 2026), an increase of 4% from the same six months in the previous year.
- In the latest year, 97.2% of complaints were closed within 20 working days. In the latest six months, 96.8% of complaints were closed within 20 working days.
- Punctuality or reliability was the most common cause of complaints to train operators in the latest year (1 April 2025 to 31 March 2026), accounting for 18.4% of all complaints.
- Overall, 84.5% of complaints were made by email or webform in the latest year.
Previous statistical releases
-
2025-26
-
2024-25
-
2023-24
-
2022-23
Data tables
-
Biannual
- Table 4100: Complaints closed by operator
- Table 4110: Complaints per 100,000 journeys
- Table 4113: Complaints per 100,000 journeys by operator
- Table 4130: Complaints categories
- Table 4133: Complaints categories by operator
- Table 4150: Complaints responded to within 10, 20 and 30 working days
- Table 4153: Complaints responded to within 10, 20 and 30 working days by operator
-
Annual