Rail industry finance (UK)

Annual statistics reporting income and expenditure for Network Rail, passenger operators (both franchised and open access) and other sectors of the UK rail industry including Northern Ireland. It also includes data for government support to the rail industry. Before 2019-20, detailed analysis was published in the UK rail industry financials.
For details on how these statistics are compiled, please see our Rail finance quality and methodology report and for information on any revisions, please see our Revisions log.
Data and reports that include previous statistical releases on Rail investment and subsidies can be found on the National Archives. Previous UK rail industry financial reports can be found on the ORR website.
Our statistical practice is regulated by the Office for Statistics Regulation (OSR).
If you have any questions or feedback on these statistics, please contact rail.stats@orr.gov.uk
Latest statistical release
Rail industry finance (UK), April 2024 to March 2025
Date published: 25 Nov 2025
Date next published: TBC
Key results
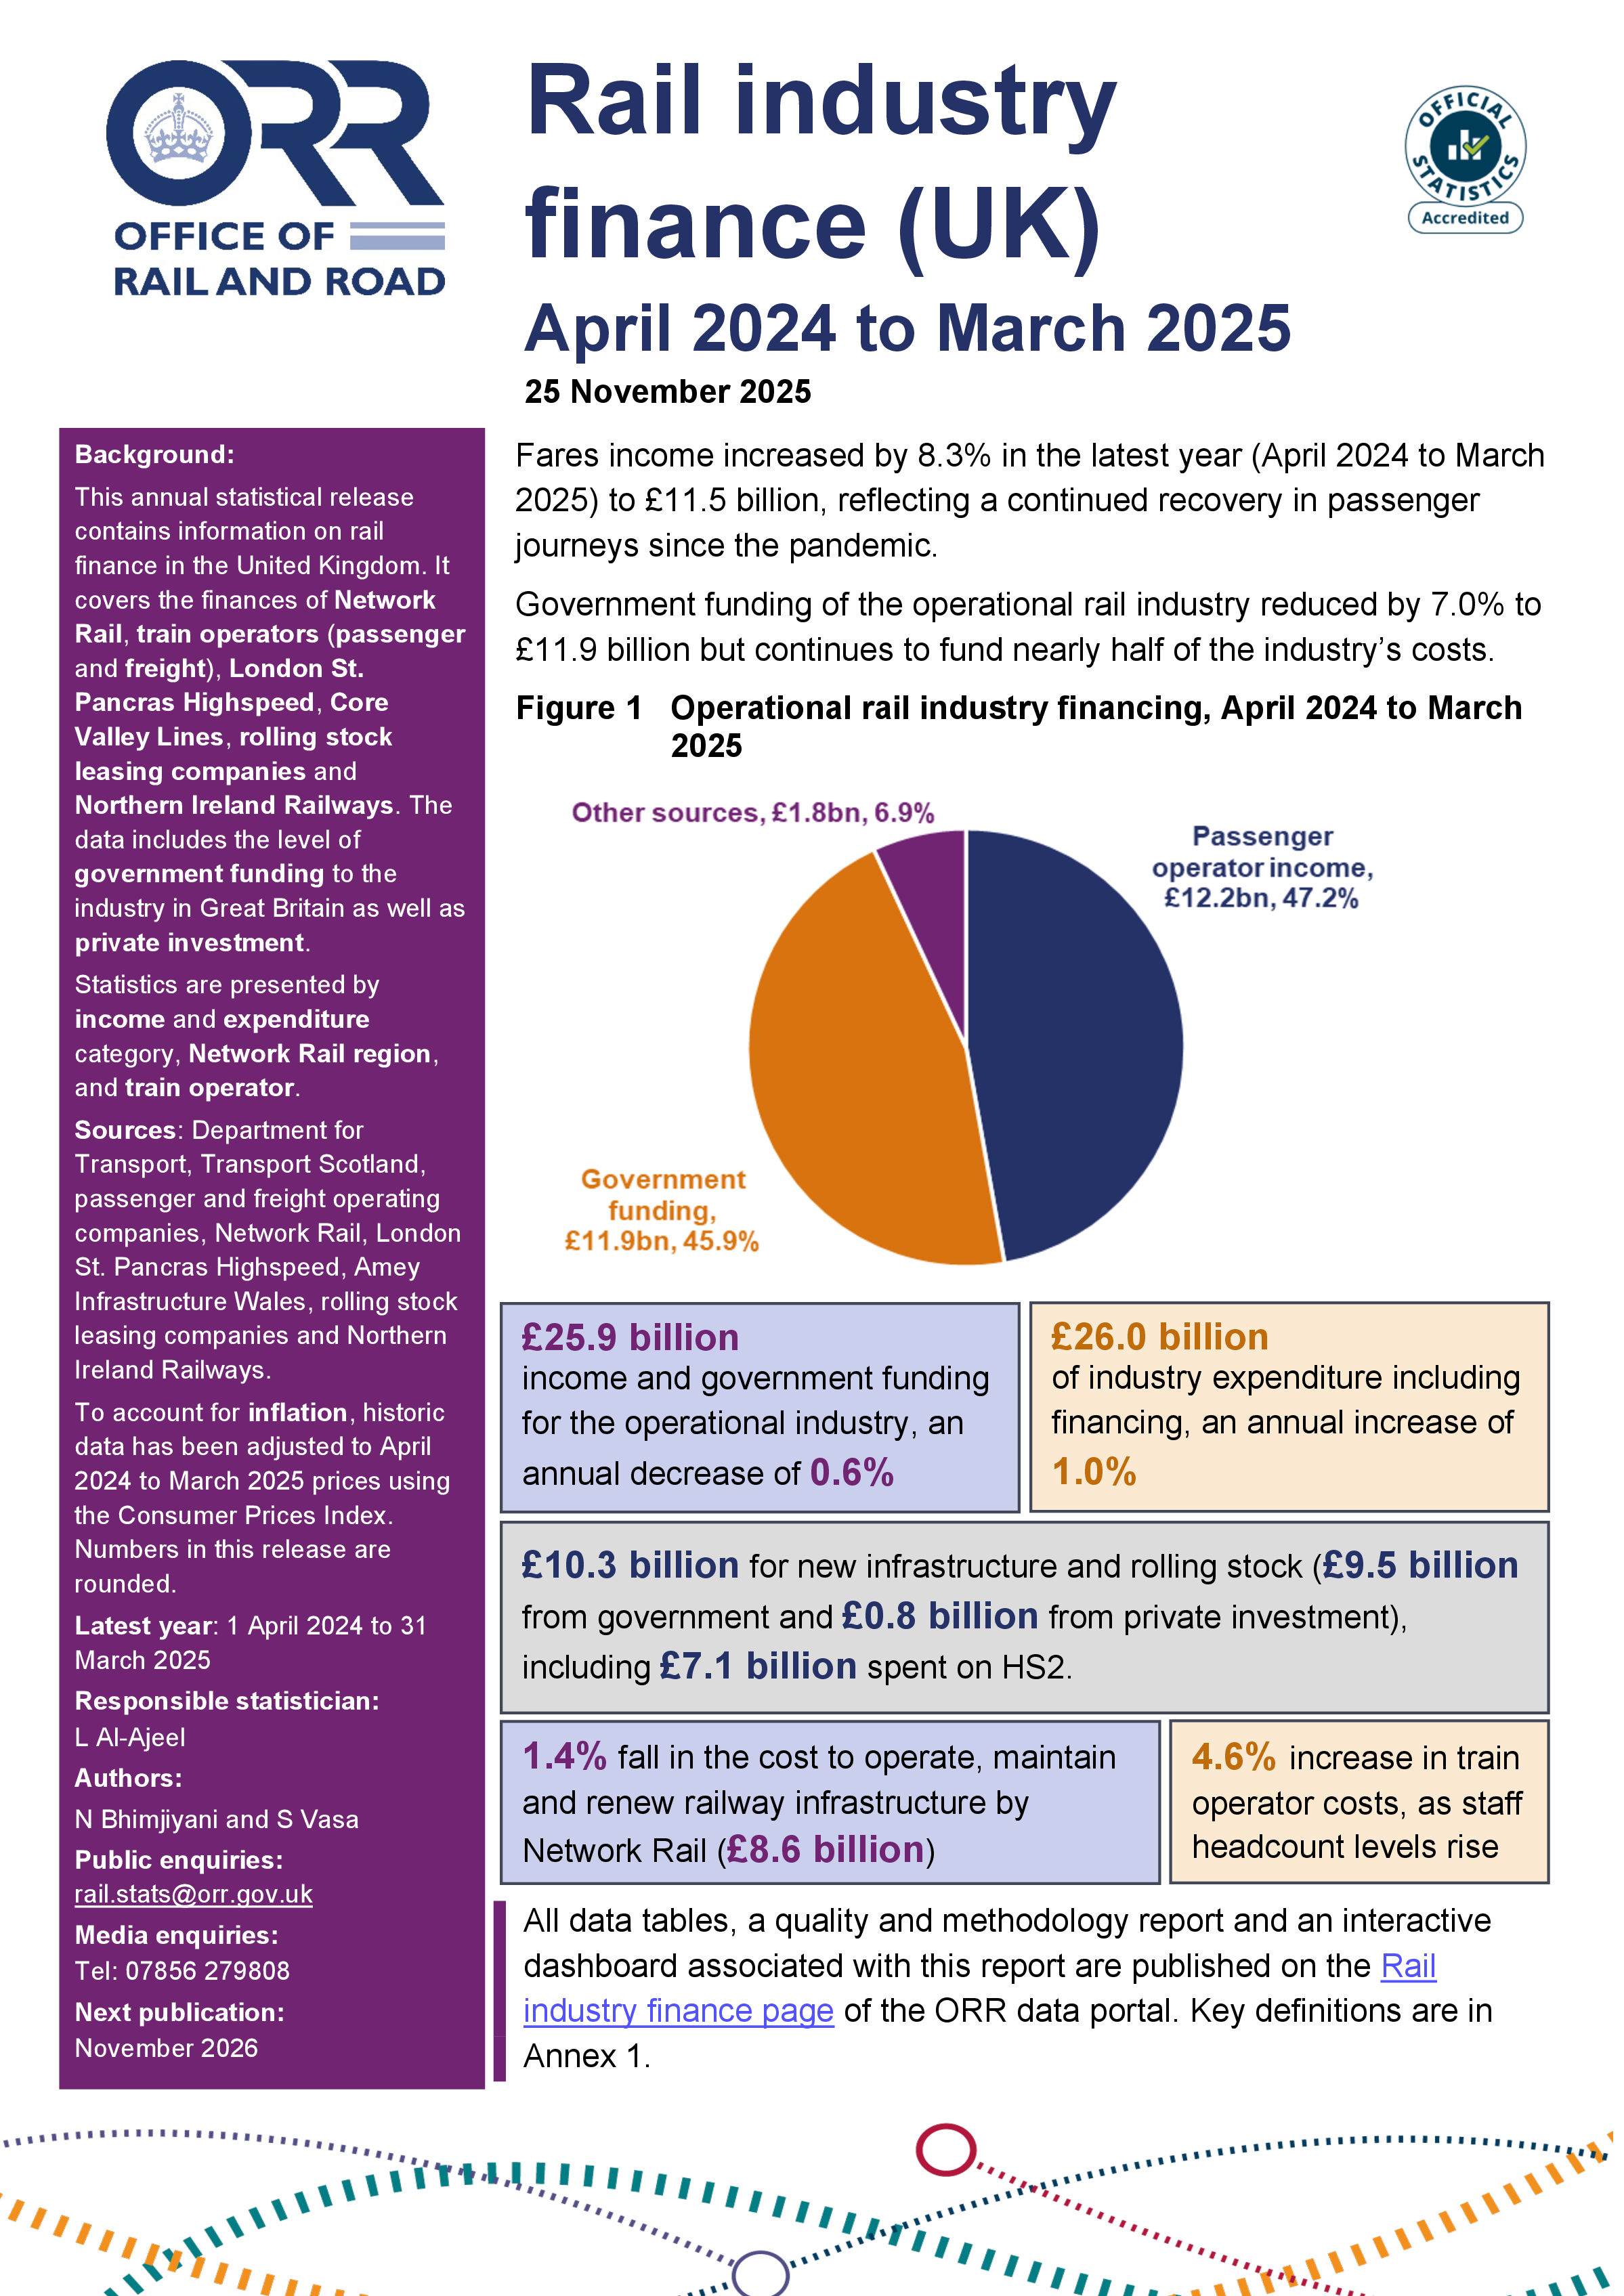
- Fares income increased by 8.3% in the latest year (April 2024 to March 2025) to £11.5 billion, reflecting a continued recovery in passenger journeys since the pandemic. Government funding of the operational rail industry reduced by 7.0% to £11.9 billion but continues to fund nearly half of the industry’s costs.
- Total income for the operational rail industry was £25.9 billion. Adjusted for inflation this is a decrease of 0.6% compared with the previous year. This consisted of £11.9 billion from government funding, £12.2 billion from passenger operators (£11.5 billion of fares and £0.7 billion of other operator income), and £1.8 billion from other sources.
- Total expenditure for the operational rail industry was £26.0 billion. Adjusted for inflation this is a 1.0% increase compared with the previous year. This consisted of £13.4 billion of franchised train operator expenditure, £11.1 billion of Network Rail expenditure and £1.4 billion of expenditure by other parts of the rail industry.
Previous statistical releases
-
2023-24
-
2022-23
-
2021-22
-
2020-21
-
2019-20
Data tables
-
Annual
- Table 7210 – UK rail industry finances since 2015-16 by country and NR region
- Table 7214 – GB rail industry finances by country and NR region(latest year)
- Table 7215 – GB Rail Industry Finances by country And NR Region Normalised by Passenger Kilometres(latest year)
- Table 7216 – GB Rail Industry Finances since 2015-16 by country And NR Region
- Table 7223 – Franchised Passenger Train Operator Finances by Franchise(latest year)
- Table 7226 – Franchised Passenger Train Operator Finances since 2015-16 by Franchise
- Table 7233 – Non Franchised Passenger Train Operator Finances since 2015-16 by Operator
- Table 7243 – Freight Train Operator Finances since 2015-16 by Operator
- Table 7250 – London St. Pancras Highspeed
- Table 7260 – Northern Ireland Railways Finances
- Table 7265 - Core Valley Lines Finances
- Table 7270 - Government support to the rail industry
- Table 7271 – Government support to the rail industry by source and recipient
- Table 7290 - Private sector investment in the rail industry (excludes Network Rail investment)
- Table 7273 - Government subsidy by franchised passenger operator(up to 2018-19)
- Table 7275 - Rolling stock leasing company finances