Freight rail usage and performance
Quarterly and periodic (4-weekly) statistics on the volume of freight transported by rail and the punctuality of those services. Annual updates are made in the January to March quarter to freight train volumes on the network in Great Britain, the market share for rail freight compared to other modes and the effect of rail freight on road haulage.
Periodic operational data is supplied to us from Network Rail on a periodic (4-weekly) basis and is contained in table 1311, 1314, 1351, 1352, 1361 and 1362. The timeframe for publishing these on the data portal is driven by when we receive the data and also when any queries we have on the validity of data are resolved. Therefore, it can take up to 15 working days after period end for the table to be updated.
Data is shown by financial year quarter: Q1 is April to June; Q2 is July to September; Q3 is October to December; and Q4 is January to March.
For details on how these statistics are compiled, please see our Freight quality and methodology report and for information on any revisions, please see our Revisions log.
Data and reports that include previous statistical releases on Freight rail usage can be found on the National Archives.
Our statistical practice is regulated by the Office for Statistics Regulation (OSR).
If you have any questions or feedback on these statistics, please contact rail.stats@orr.gov.uk
Latest statistical release

Freight rail usage and performance, July to September 2025
Date published: 16 Dec 2025
Date next published: 12 Mar 2026
Key results
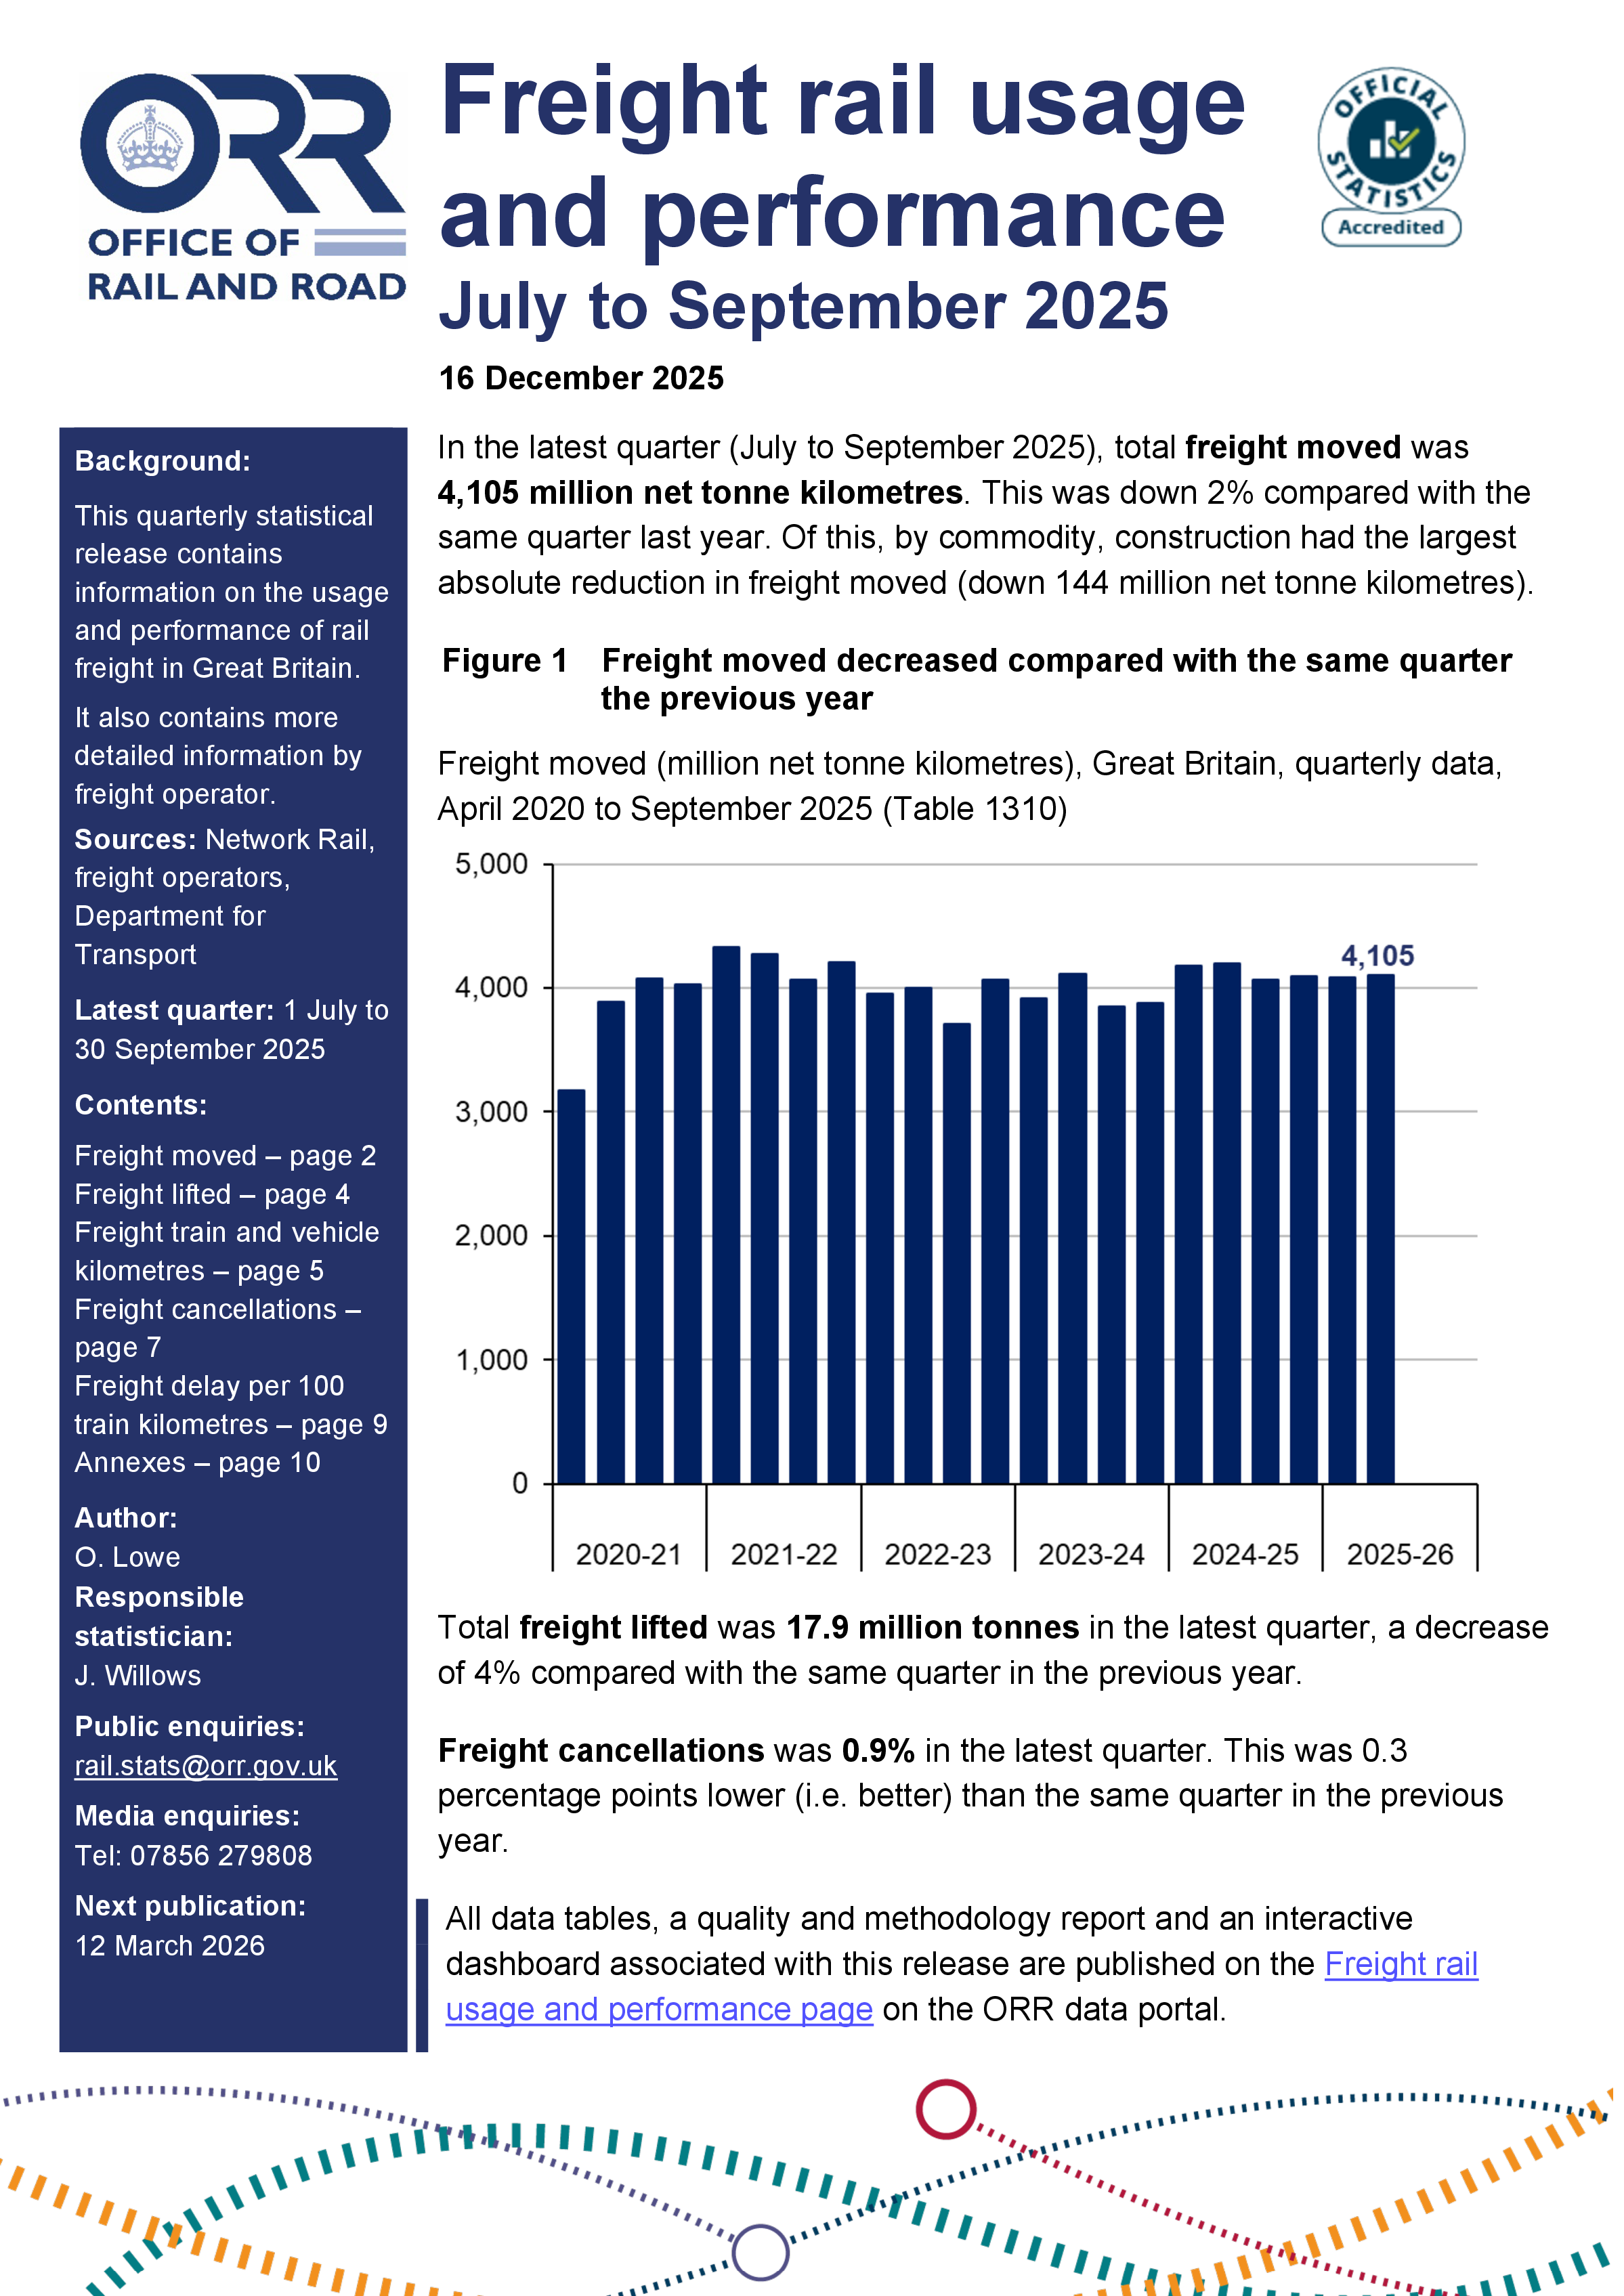
- Total freight moved was 4,105 million net tonne kilometres in July to September 2025, a decrease of 2% compared with July to September 2024.
- Total freight lifted was 17.9 million tonnes in July to September 2025.
- Freight train kilometres were 7.76 million kilometres in July to September 2025.
- Freight cancellations were 0.9% in July to September 2025.
Previous statistical releases
-
2025-26
-
2024-25
-
2023-24
-
2022-23
Data tables
-
Periodic
- Table 1311: Freight moved by Network Rail region (periodic)
- Table 1314: Freight moved by commodity (periodic)
- Table 1324: Freight Delivery Metric by Region (FDM-R)
- Table 1351: Freight cancellations by Network Rail region (periodic)
- Table 1352: Freight cancellations by Network Rail route (periodic)
- Table 1361: Freight cancellations and lateness by Network Rail region (periodic)
- Table 1362: Freight cancellations and lateness by Network Rail route (periodic)
-
Quarterly
- Table 1310: Freight moved by commodity
- Table 1315: Freight lifted
- Table 1320: Freight Delivery Metric
- Table 1325: Freight delay per 100 train kilometres
- Table 1333: Freight train kilometres by operator
- Table 1343: Freight vehicle kilometres by operator
- Table 1355: Freight cancellations
- Table 1365: Freight cancellations and lateness
-
Annual

